Java Reference
Ref: Java Debugging Details
Introduction
This article shows how to set up your IDE so that you can debug (run, hit breakpoints, single step, examine variables) your KOS backend Java code.
While these specific instructions are for IntelliJ and Eclipse, you can follow these same general steps if you use another IDE.
Overview
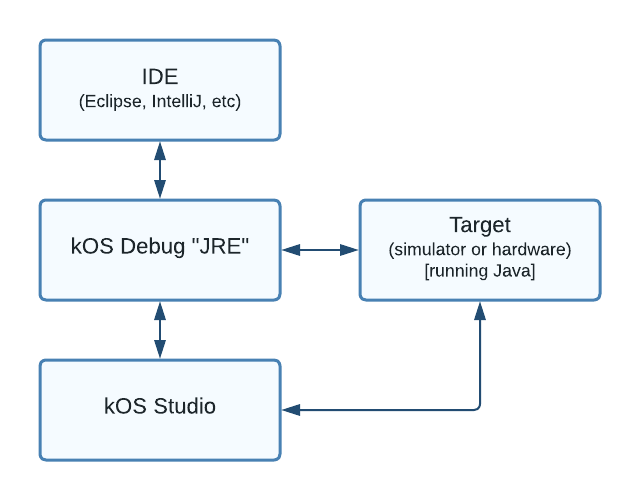
KOS gives you the ability to debug your Java code. It works whether the target system is a simulator or actual hardware.
The primary component, the "KOS Debug JRE", sits between your IDE, your running KOS Studio, and the target system.
The following diagram illustrates the interactions that occur during the debug process:
Figure 1. Overview of Java debugging
The rest of this article explains how you set up and use the KOS Debug JRE.
IntelliJ
Follow these steps when using the IntelliJ IDE. The instructions are basically the same for Linux, Mac, and Windows.
1) Run/Debug Configurations
Open the "Run/Debug Configurations" dialog.
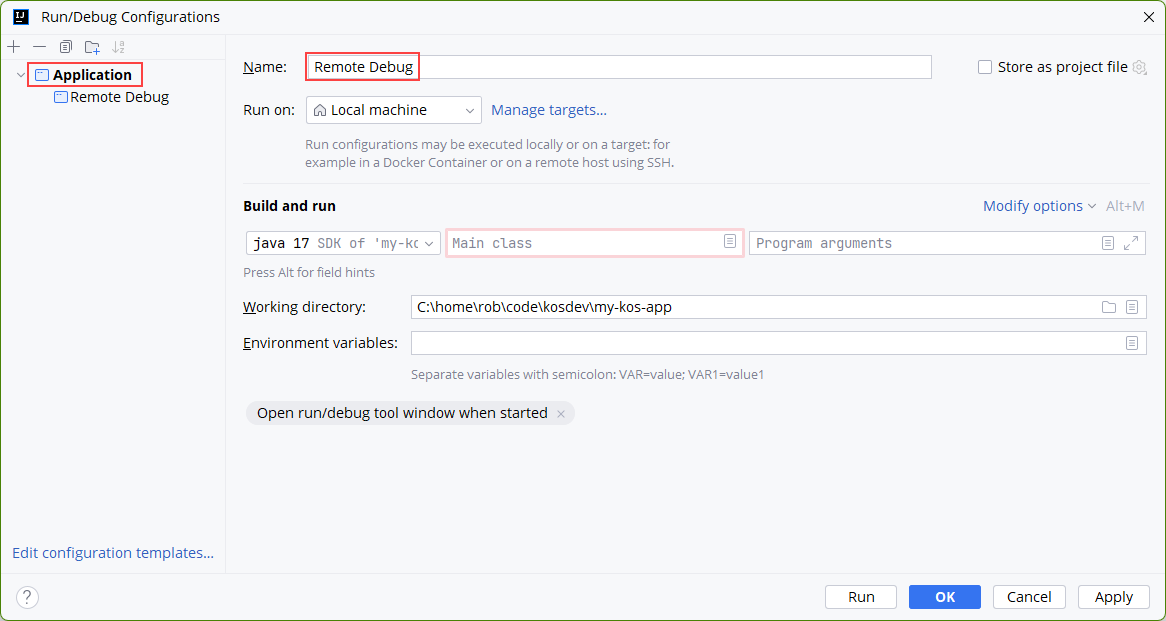
Figure 2. IntelliJ run/debug configuration
2) Alternative JRE
In the "Run" section, click to select an alternative JRE
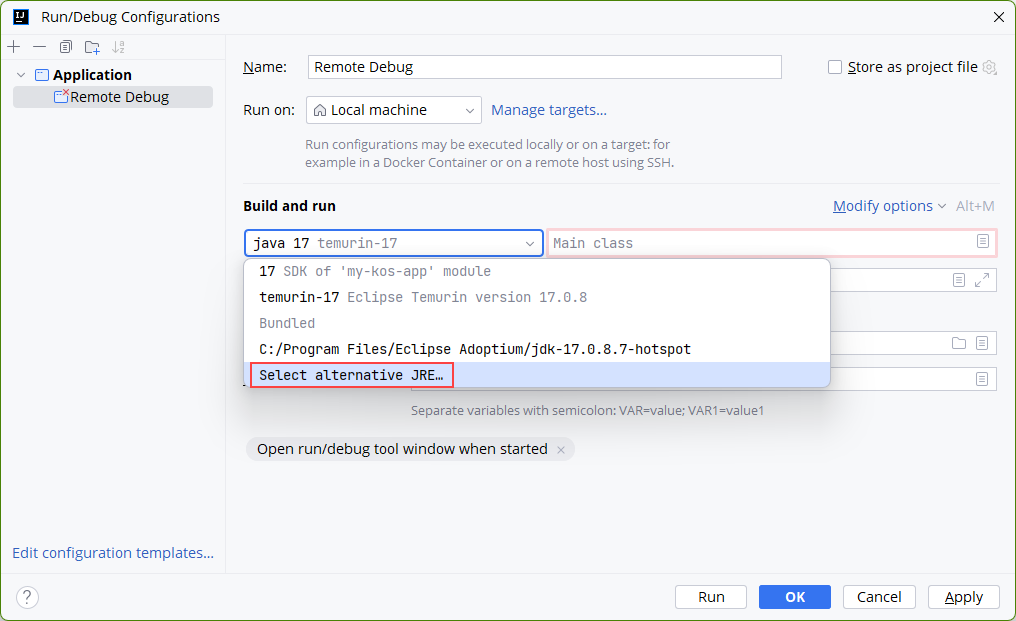
Figure 3. Select alternative JRE
3) Select JRE
Navigate to and then select the special KOS debug JRE.
|
Location of JRE files
The KOS JRE files are stored at different locations, depending on the operating system. |
Here’s the Windows JRE picker:
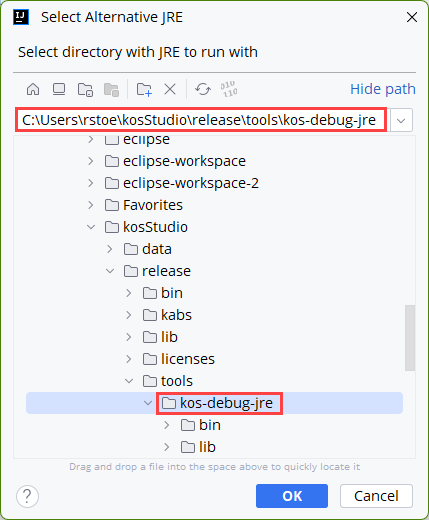
Figure 4. Directory of alternative JRE
Here’s the Mac JRE picker:
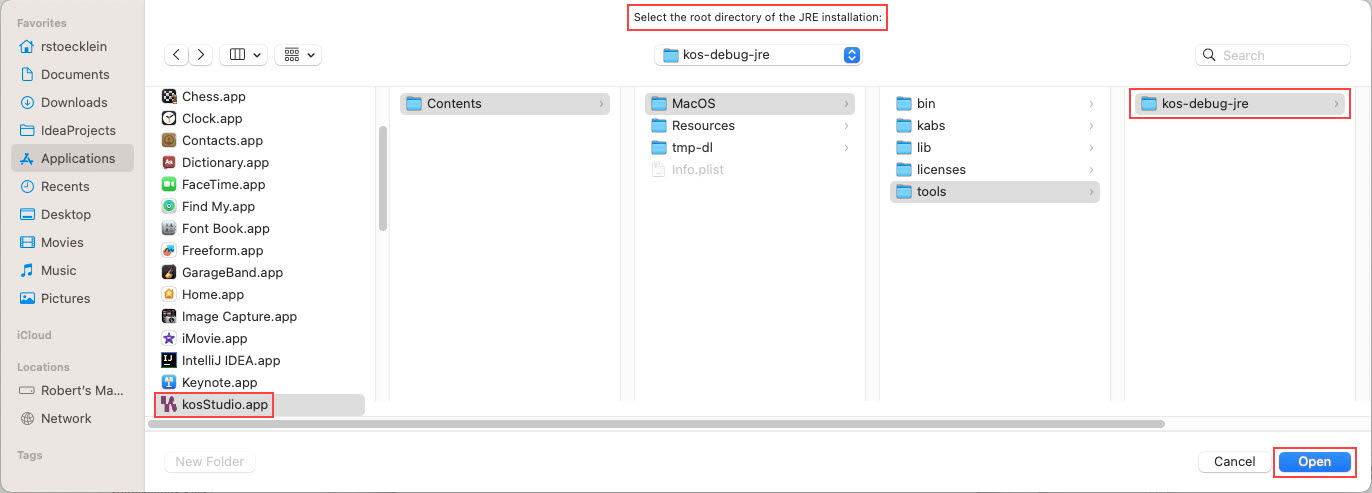
Figure 5. Mac JRE picker
4) Finish
After selecting the alternative JRE, the following appears.
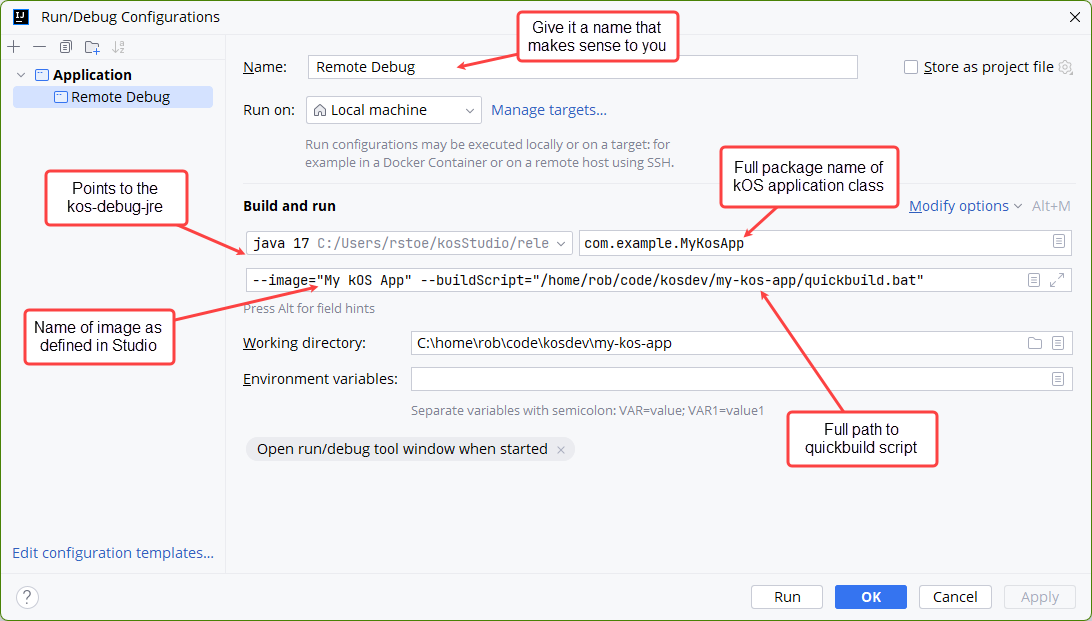
Figure 6. Debug JRE configuration complete
Notice that the JRE has changed. Click OK to close this window.
|
Debug Instructions
Details about how to fill in the main class and command line arguments are covered in the How To Debug Code tutorial. |
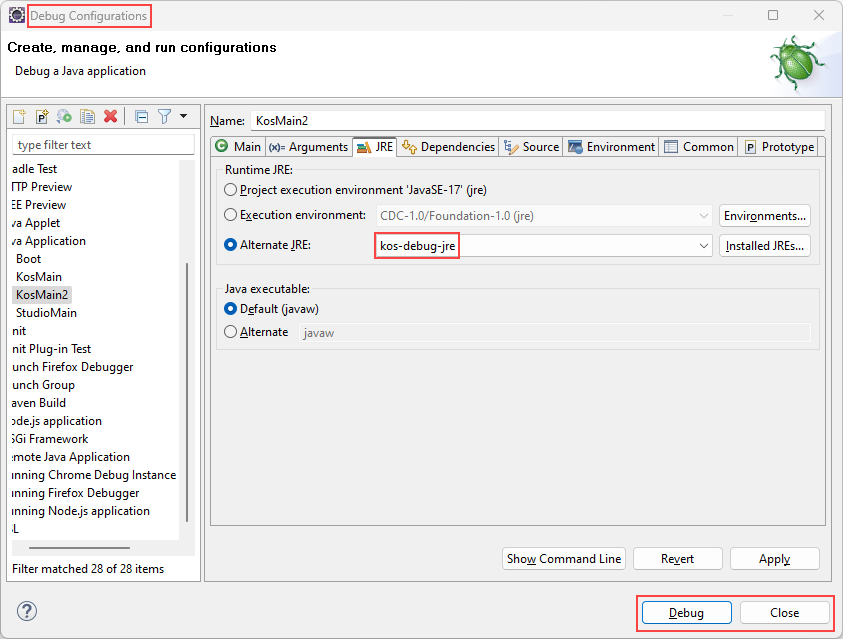
Eclipse
Follow these steps when using the Eclipse IDE. The instructions are basically the same for Linux, Mac, and Windows.
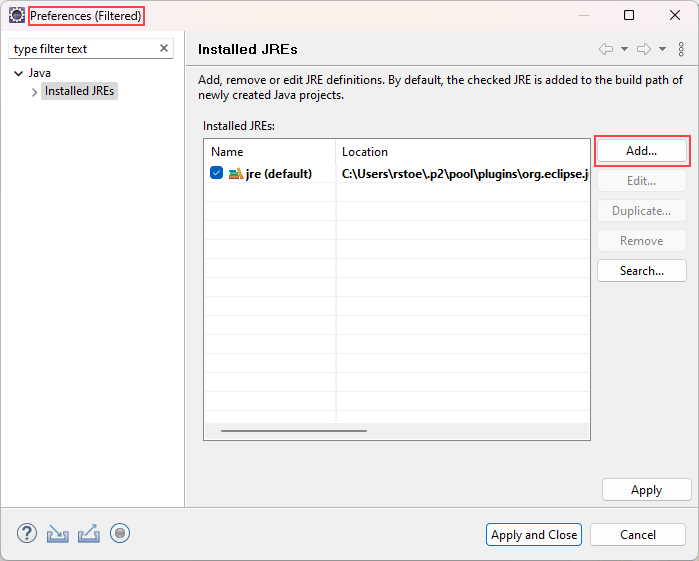
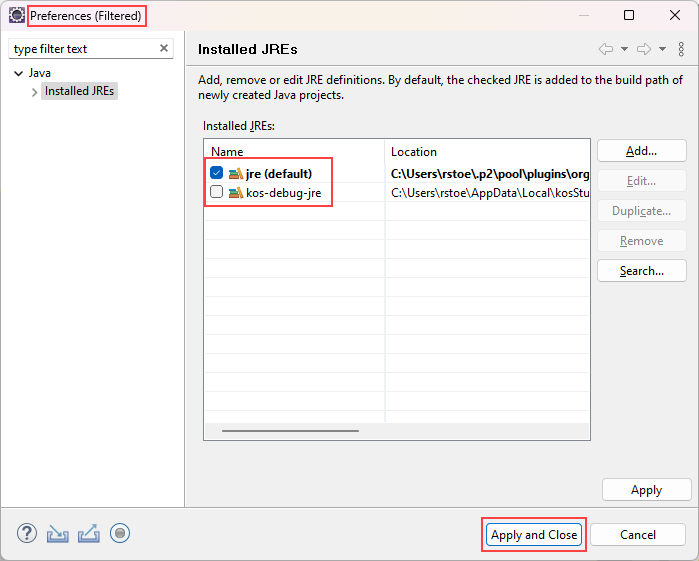
1) Debug Configurations
Open the "Debug Configurations" dialog and then click the "JRE" tab.
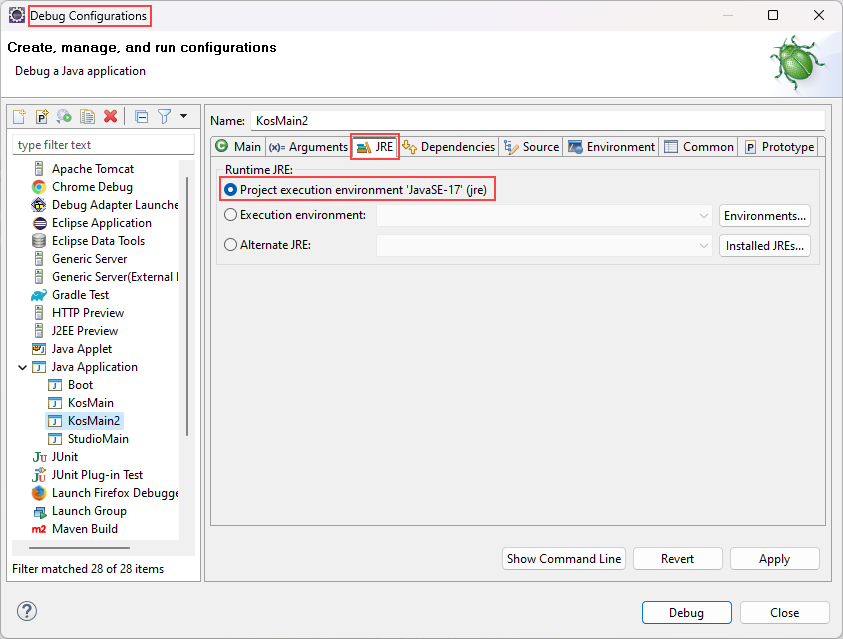
Figure 7. Eclipse run/debug configuration
2) Alternate JRE
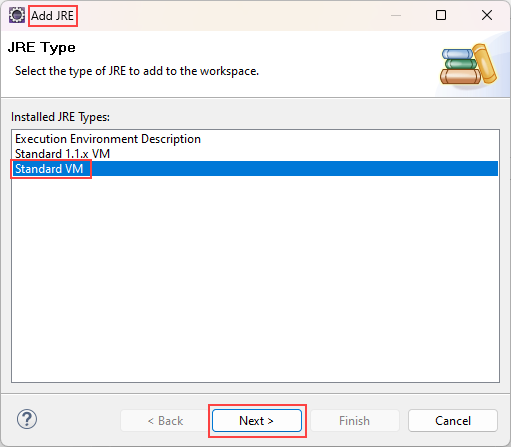
Select "Alternate JRE" and then click the "Installed JREs…" button.
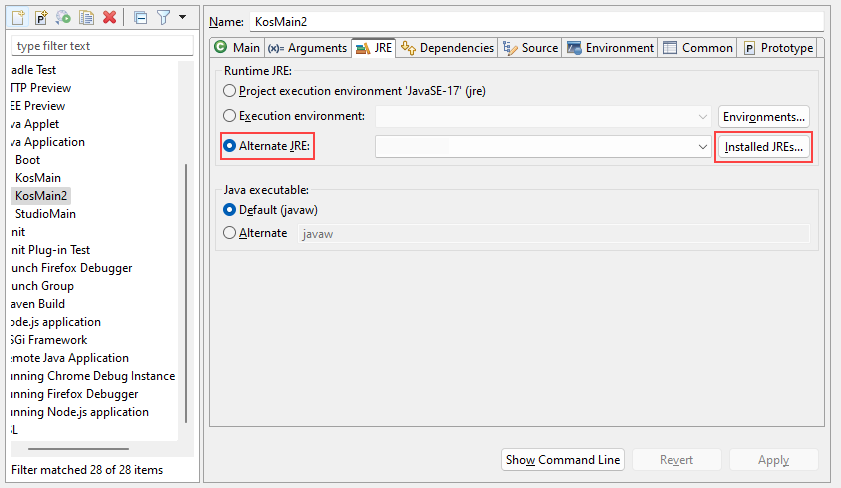
Figure 8. Select alternative JRE
5) Pick JRE
Click "Directory" and then navigate to and select the KOS JRE directory.
|
Location of JRE files
The KOS JRE files are stored at different locations, depending on the operating system. |
Here’s the Windows JRE picker:
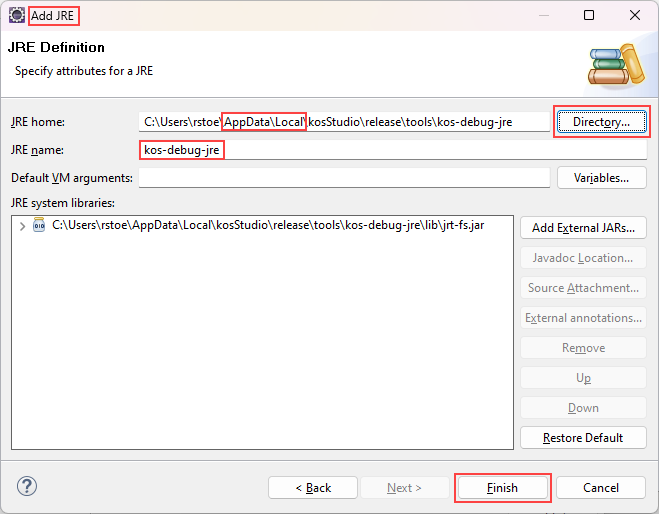
Figure 11. Windows JRE picker
Here’s the Mac JRE picker:
Figure 12. Mac JRE selector
Conclusion
In this article you learned how to configure your Java IDE to enable debugging.
Check out the How To Debug Code tutorial to find out how to actually debug your code.
On this page
Java Development
Seamlessly transition from Legacy+ systems to Freestyle microdosing and advanced distributed dispense systems.
UI Development
Using KOS SDKs, integrating Consumer and Non-consumer facing UIs becomes seamless, giving you less hassle and more time to create.
Video Library
Meet some of our development team, as they lead you through the tools, features, and tips and tricks of various KOS tools.
Resources
Familiarize yourself with KOS terminology, our reference materials, and explore additional resources that complement your KOS journey.
Copyright © 2024 TCCC. All rights reserved.